
|
|
Marin County sustainability indicators This page is a work in progress showing a collection of sustainability indicators for Marin County. For questions about this project, please contact SMV member Jørgen Vos at Sustainability Planning Partners. 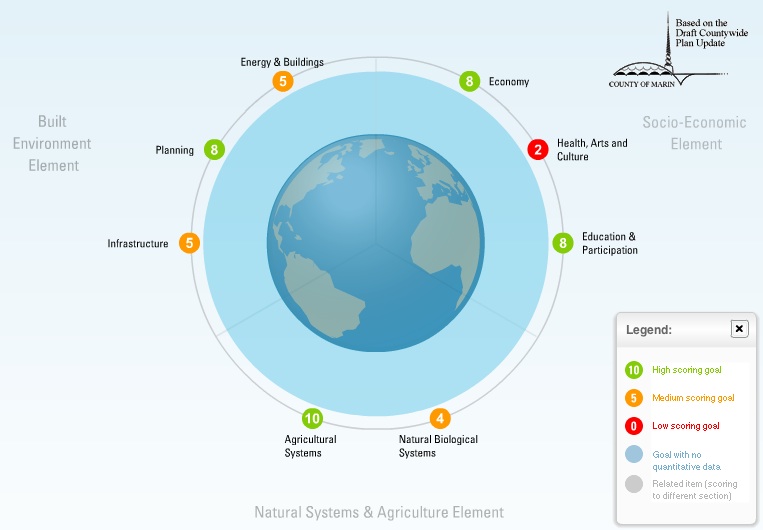 Click to launch Marin County's see-it™ viewer. Other indicators Energy use Ecological Footprint Waste More indicators will be coming soon. Energy use 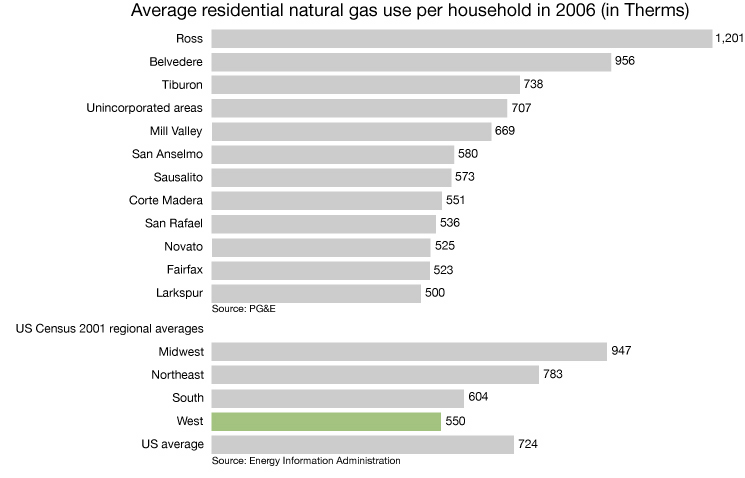 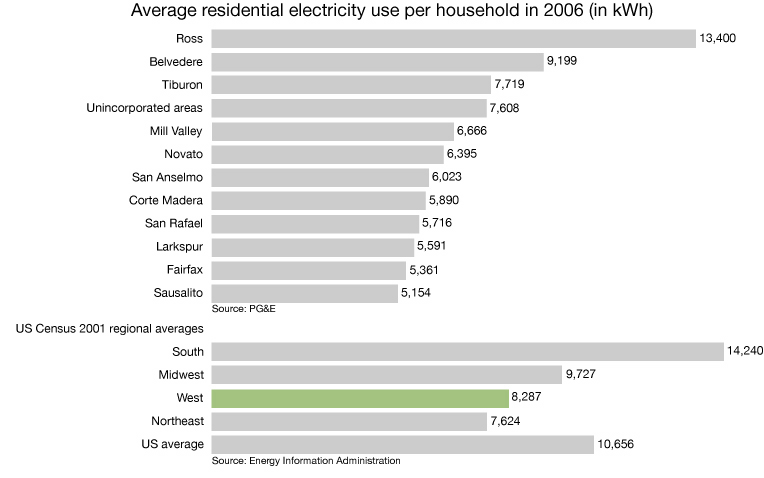 Note: as you may have noticed, most Marin households are using quite a bit less electricity than the average Western U.S. household. The explanition for this is most likely the relatively much lower use of airconditioners as a result of our cooler climate compared to other counties and (especially southern) states. Ecological Footprint The Ecological Footprint (see Global Footprint Network for more details) looks at the total annual resource use of humanity and compares this with the resources planet Earth makes available each year and the land area required to make those resources available. The Ecological Footprint per capita for the U.S. is around 23 acres. The globally available biocapacity per capita is only 4.4 acres. This means that if everybody in the world were to live like U.S. residents, we'd need more than 5 planets to make available without depleting the planet all the resources we use. There have been 2 studies that have included calculations of Marin County's Ecological Footprint, one using year 1999 data, and one using year 2001 data. The results of these studies show a significant difference in their results. This may partly be caused by refinements in the methods of estimating regional footprints, as well as the quality of available regional data at the time. The following tables reflect Marin's Ecological Footprint as calculated in 2002 (using 1999 data) and in 2003 (using 2001 data). We are including Sonoma County's results for the sake of being able to compare the results. 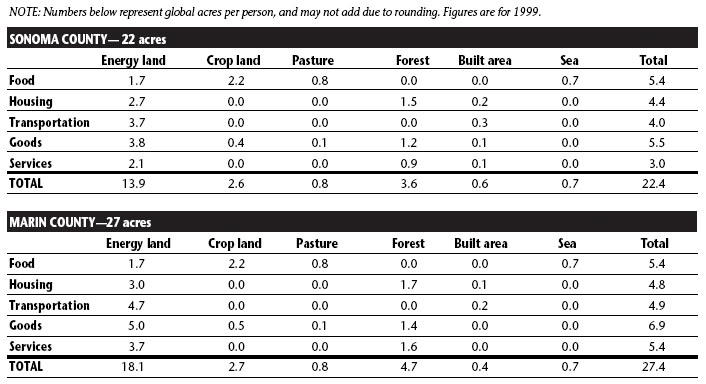 Source: Sustainable Sonoma County, published May 2002. 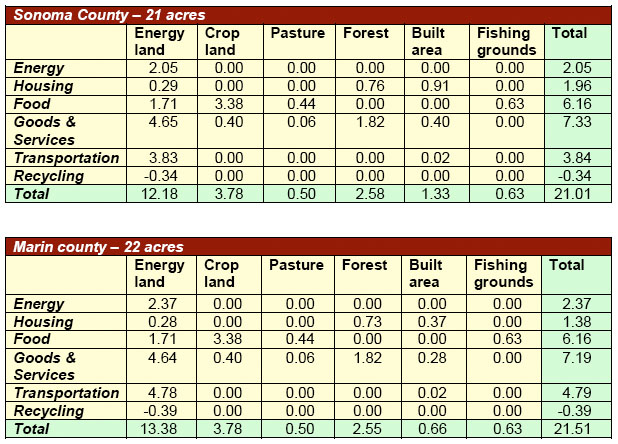 Source: Regional Progress, published 2003. The first difference we notice between the two studies is the reduction in estimated Ecological Footprint for both Marin and Sonoma counties. The change is most dramitic for Marin County with a reduction from an estimated 27 acres to less than 22 acres. The main contributor to this reduction is the revision of the amount of energy use allocated to the purchase of goods and services. In the first study this amount was estimated to be proportional to the per capita income of the counties, which likely led to an overestimation of Marin's 1999 per capita footprint. Whether Marin's per capita footprint is closer to 22 acres (less than the U.S. average) or to 27 acres (more than the U.S. average) is a question that will require further study. We would very much welcome a new study of Marin County's Ecological Footprint using more current data. Marin's households use less energy than the average U.S. resident, as shown by the energy use indicators. Our energy sources are also cleaner due to PG&E not making use of coal-fired power plants and having access to hydro-power. On the other hand, Marin is wealthier which is an indicator of lifestiles that consume more resources. Waste Marin County is know for its environmentally aware residents. When California celebrated reaching it's goal of cutting waste in half compared to 1990, Marin was hailed by the California Integrated Waste Management Board (CIWMB) as the county with the highest waste diversion rate in the state (see CIWMB press release). The picture may however be less rosy then this statistic suggests. The following graphs and data gathered at the CIWMB site provide a more complete picture.   Residential daily waste disposal in pounds per resident per day and Business daily waste disposal in pounds per $100 of sales.  Total amount of physical waste disposed and diverted in tons per year. These graphs seem to tell the following story:
The difference between waste expected to be generated and actual waste generated is called waste avoided and is added to the amount of physical waste diverted to form what is finally called waste diverted. The vast majority of waste diverted thus is in reality waste avoided, in many cases resulting from smarter packaging and other waste reduction initiatives undertaken by businesses and their suppliers. Another factor may be that Marin residents have been buying more expensive products, as suggested by the significant rise in taxable sales (rising well ahead of inflation). These products may come with less packaging per Dollar spent, thereby reducing waste per Dollar while at the same time increasing the theoretical amount of waste avoided.  Diversion rate adjustment factors for Marin County. Provided for information purposes, the following table gives a quick comparison of waste generation between 7 Bay Area counties. Since each county is different in terms of typical household structures as well as types and number of businesses present, there is significant difference in the waste generation patterns of each. 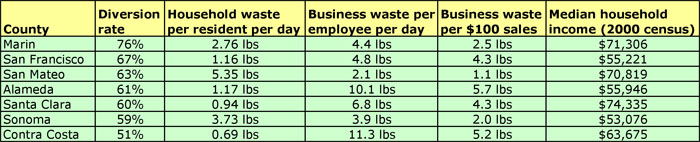 |
||||
All text and images on this site © 2002-2007 Sustainable Mill Valley Last updated: 06/26/07 |
||||